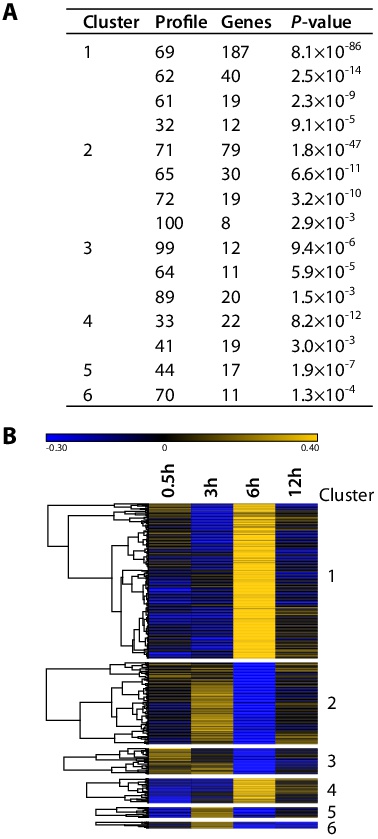
Fig. 6. Significant temporal expression profiles of genes modulated by MC1R activation in migrating HAoECs. (A) List of significantly enriched temporal expression patterns identified by STEM analysis. Expression profiles are grouped into six clusters based on their similarity (r ≥ 0.7) and ordered by p-value significance within each cluster profile. The number of genes belonging to a profile is reported. (B) Heatmap depicting temporal expression of genes within each cluster. Genes hierarchically clustered into 6 groups using one minus Pearson correlation distance and the average linkage method. Data are the average log2 gene expression ratio of α-MSH stimulated cells to non-stimulated cells (n = 3 independent experiments, with two technical replicates each). Normalized expression ratios are shown as a gradient colour ranging from lower (blue) to higher (gold) values.